Technical analysis is a method of evaluating securities by analyzing statistics generated by market activity, such as past prices and volume. Technical analysts believe that the historical performance of a security, as well as market conditions, can be used to predict its future performance.
There are many different technical analysis tools that can be used to evaluate securities and make trading decisions. Some of the most popular and widely used include moving averages, relative strength index (RSI), and Bollinger Bands.
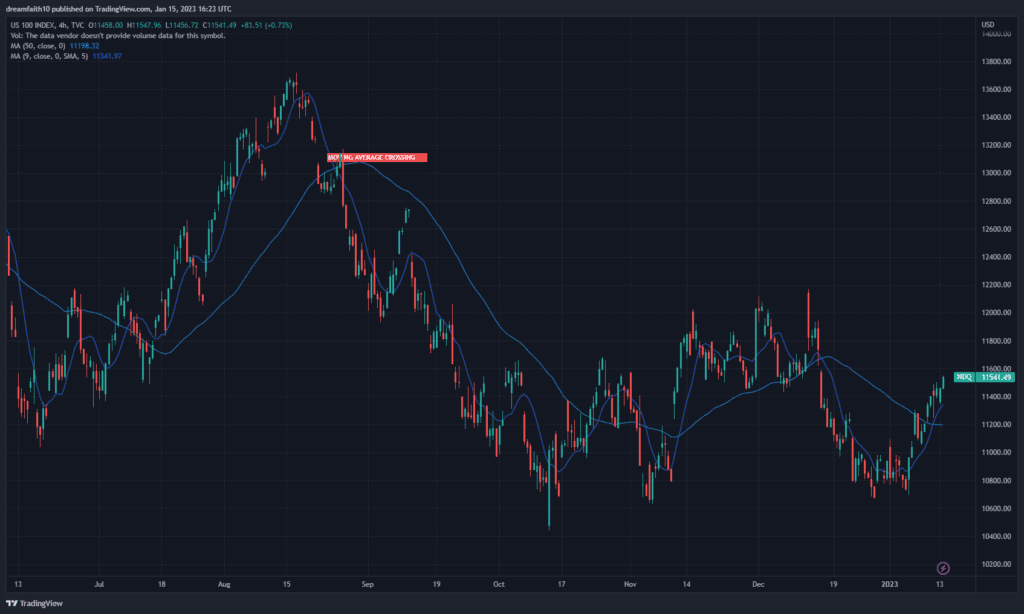
Moving averages are a simple and popular tool that can be used to smooth out fluctuations in a security’s price. A moving average is calculated by taking the average of a security’s price over a certain period of time, such as 10 days or 50 days. The resulting line can be used to identify trends in the security’s price, and can also be used to generate buy and sell signals.

Relative strength index (RSI) is another popular technical analysis tool. RSI is a momentum indicator that compares the magnitude of a security’s recent gains to the magnitude of its recent losses, and is used to identify overbought or oversold conditions. A security is considered overbought when its RSI is above 70, and oversold when its RSI is below 30.

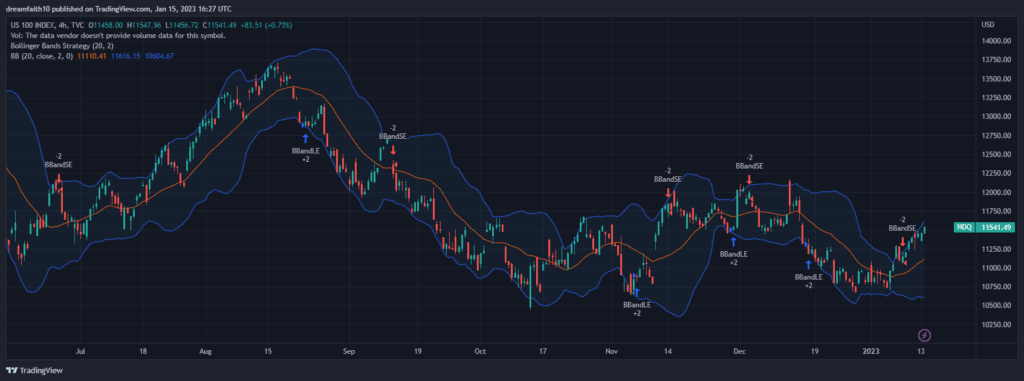
Bollinger Bands are a technical analysis tool that is used to measure a security’s volatility. Bollinger Bands consist of a moving average and two standard deviation lines that are plotted two standard deviations away from the moving average. When a security’s price moves outside of the Bollinger Bands, it is considered to be overbought or oversold.

In addition to these three popular technical analysis tools, there are many other tools available that can be used to evaluate securities and make trading decisions. Some other popular tools include Fibonacci retracements, candlestick charts, and head and shoulders patterns.
One important thing to keep in mind when using technical analysis tools is that they should be used in conjunction with other types of analysis, such as fundamental analysis. Technical analysis is a great way to identify trends and make trading decisions, but it should not be used as the sole basis for making investment decisions.
In conclusion, technical analysis is a powerful tool that can be used to evaluate securities and make trading decisions. Some of the most popular and widely used technical analysis tools include moving averages, relative strength index (RSI), and Bollinger Bands. However, it’s important to keep in mind that technical analysis should be used in conjunction with other types of analysis and not as the sole basis for making investment decisions.

